The biggest logistics challenge of a generation
After a year of turmoil, lockdowns and new waves of infections, the vaccine offers some hope for a return to something like ‘normality’. But how long will it really take to vaccinate the UK? And what are some of the challenges we face?
![]()
Simulating the UK vaccination programme
At 7bridges we use our artificial intelligence to model, plan and optimise the execution of complex logistics networks. We’ve used our cutting-edge technology to simulate the rollout of the COVID-19 vaccines in the UK, to gain insights into the potential timelines and challenges faced in the quest to reach herd immunity and return to 'normality'.
This first simulation looks at the first phase of the rollout, which is targeting everyone over the age of 50 years old, executed in 7 ‘waves’ and considers the impact of the UK's new 'single jab' strategy and how this changes the prognosis for the country.
What insights does the simulation offer?
- How long will it take to vaccinate people in Phase 1 and what impact does the new strategy have on the timelines and inoculation rates?
- When could each wave reach herd immunity?
- Which locations are likely to be inoculated first
The logistics of the UK vaccinations
- Where will vaccinations take place?
- Which areas demand greater supply?
- How might the Pfizer and Oxford drugs be distributed over time?
- How far will people need to travel in order to receive their jab?
- Which parts of the UK are likely to be vaccinated first?
Impact of Anti-Vaxxers
- What impact might anti-vaxx sentiment have on herd immunity and the maximum inoculation rates?
- How are different regions impacted by anti-vaxx sentiment?
Key findings
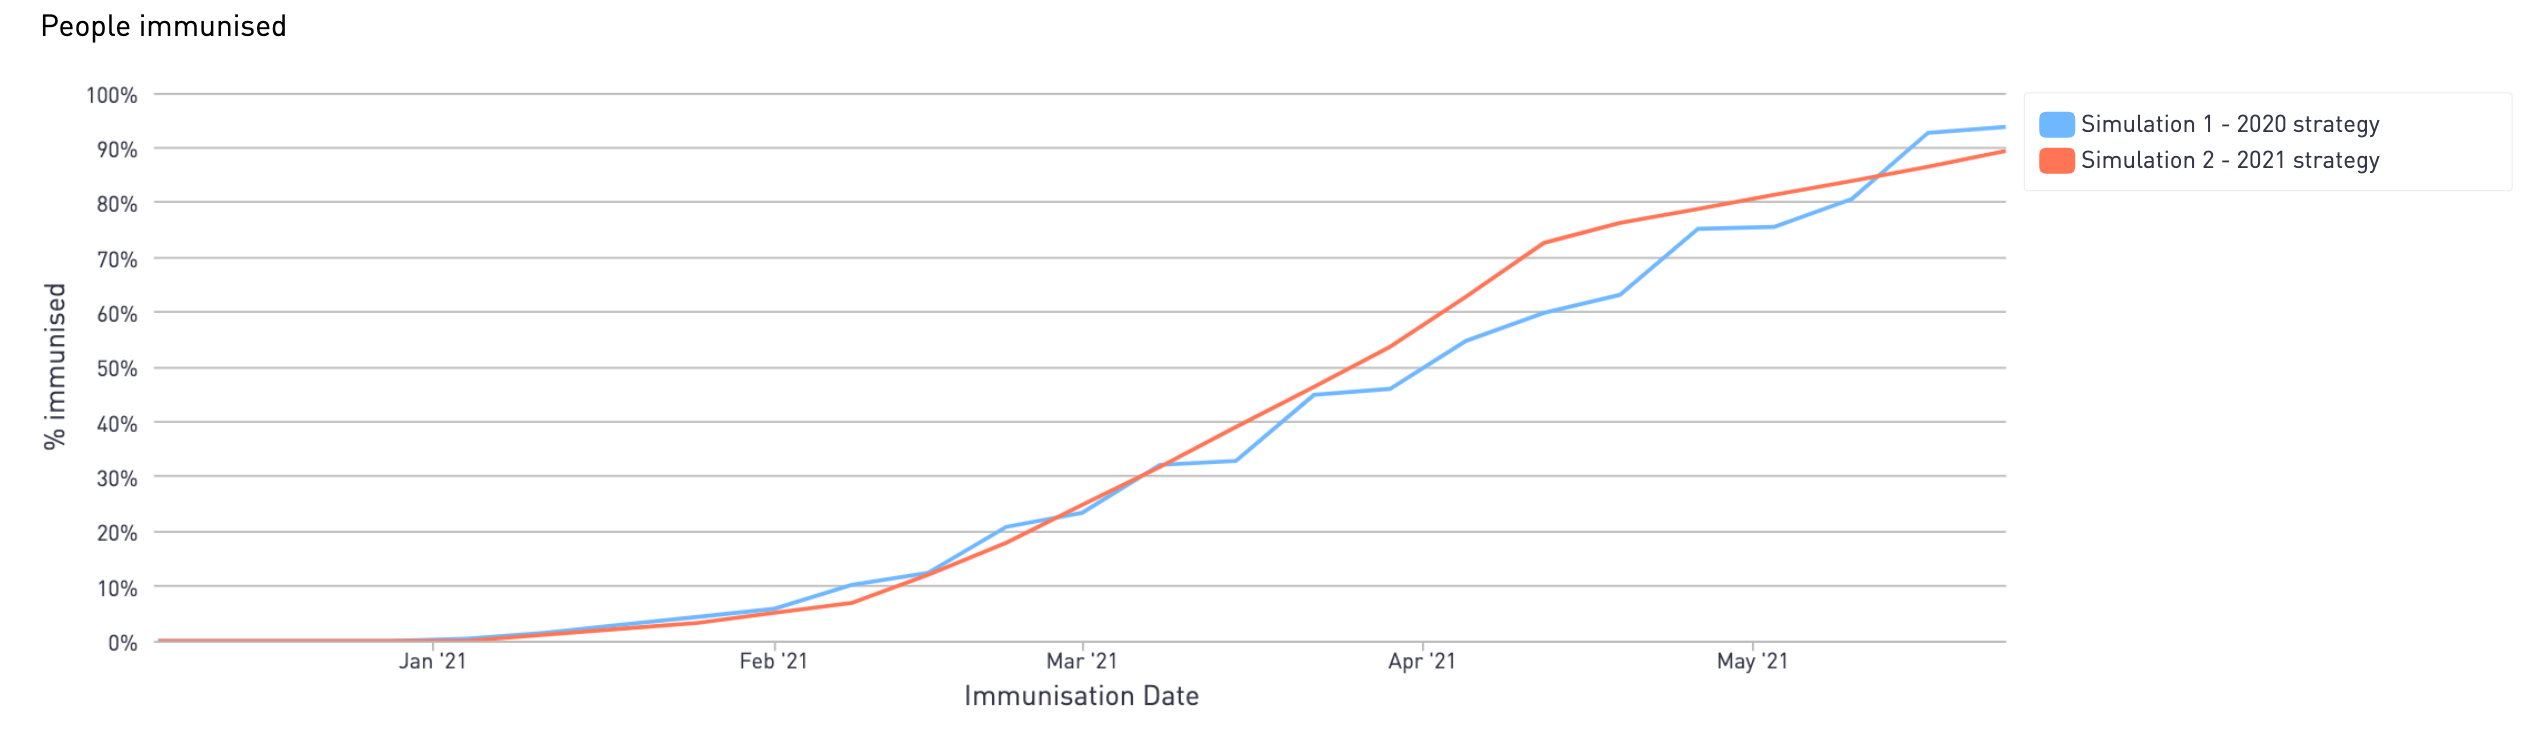
The change in strategy in January 2021, has brought forward the 'herd immunity' milestone by three weeks for Phase 1 vaccine recipients in the UK.
 On the penultimate day of 2020, the Oxford vaccine was approved for use in the UK. On the same day, medics were informed of a new strategy - to delay patients’ second dose by up to 12 weeks after the first.
The simulation shows that in a best-case scenario, the 2020 strategy could have seen 70% of Phase 1 recipients immunised by their first dose in the week commencing the 26th April.
The new strategy brings forward this milestone to the week commencing the 5th April, despite lower throughput across vaccination sites.
Immunisation simulation - Phase 1 immunisation timeline, 2020 strategy vs 2021 strategy
Who is being vaccinated in Phase 1?
Phase 1 includes everyone over the age of 50, and will be executed in seven waves:
| Wave | Who? |
| 1 | People aged over 80 and over |
| 2 | People aged 75 and over |
| 3 | People aged 70 and over and those who are clinically extremely vulnerable |
| 4 | People aged 65 and over |
| 5 | People aged 60 and over |
| 6 | People aged 55 and over |
| 7 | People aged 50 and over |
For the purpose of this simulation, frontline workers and the clinically vulnerable are not included, as there is no reliable locational data for these groups available.
2021 strategy - the logistics of the UK vaccination programme
Vaccine distribution sites
 According to government sources, the COVID-19 vaccine will be administered to Phase 1 recipients in a UK-wide network of:
- 95 hospitals
- 15 mass vaccination centres*
- 1000 GPs
*mass vaccination sites expected to increase to 50. This ramp up is accounted for in the simulation.
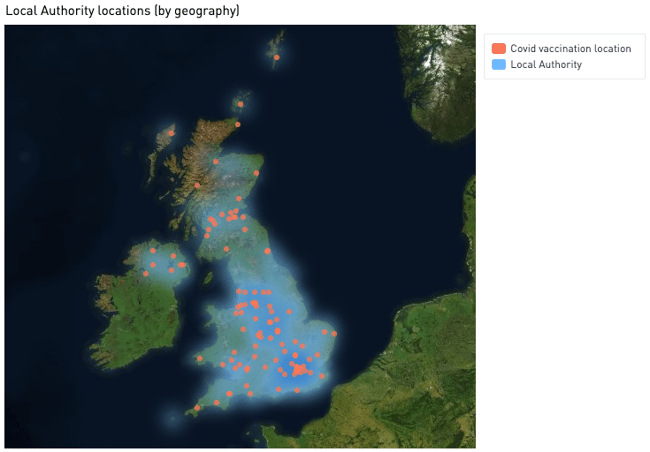
By using the information about vaccination sites, and population data from the ONS, we are able to simulate the vaccine demand for each location.
Vaccine supply and demand
How many doses does each administering site need?
Our artificial intelligence considered how much vaccine needs to be available at each of the government selected sites in order to vaccinate people.
It did this by looking at population density, and the closest hospital and GP to people in each local authority. The simulation shows a distinct regional demand difference between Local Authorities, for Phase 1 recipients of the vaccine.
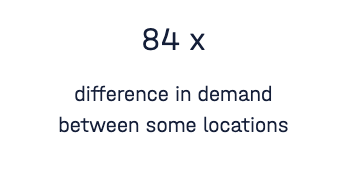 For example, the Newcastle Upon Tyne hospitals and surrounding GPs will need 1.53M doses of the Pfizer and Oxford vaccines; 84 times that of Western Isles Hospital in Stornoway and nearby GPs (that needs just 18.2K doses).
- The success of the Phase 1 rollout will rely, in part, on the ability to distribute the correct volume of vaccine to local authorities, according to this demand.
- The immunisation sites will also need to safely store the drugs - no small feat for the GPs administering the Pfizer vaccine, which requires a storage temperature of -70c
Immunisation simulation - Vaccinations demanded by site, 2021 strategy
%20(2).png?width=600&height=713&name=Vaccinationsdemandedpervaccinationsite%20(1)%20(2).png)
Which drugs are available, and what is the capacity to administer them?
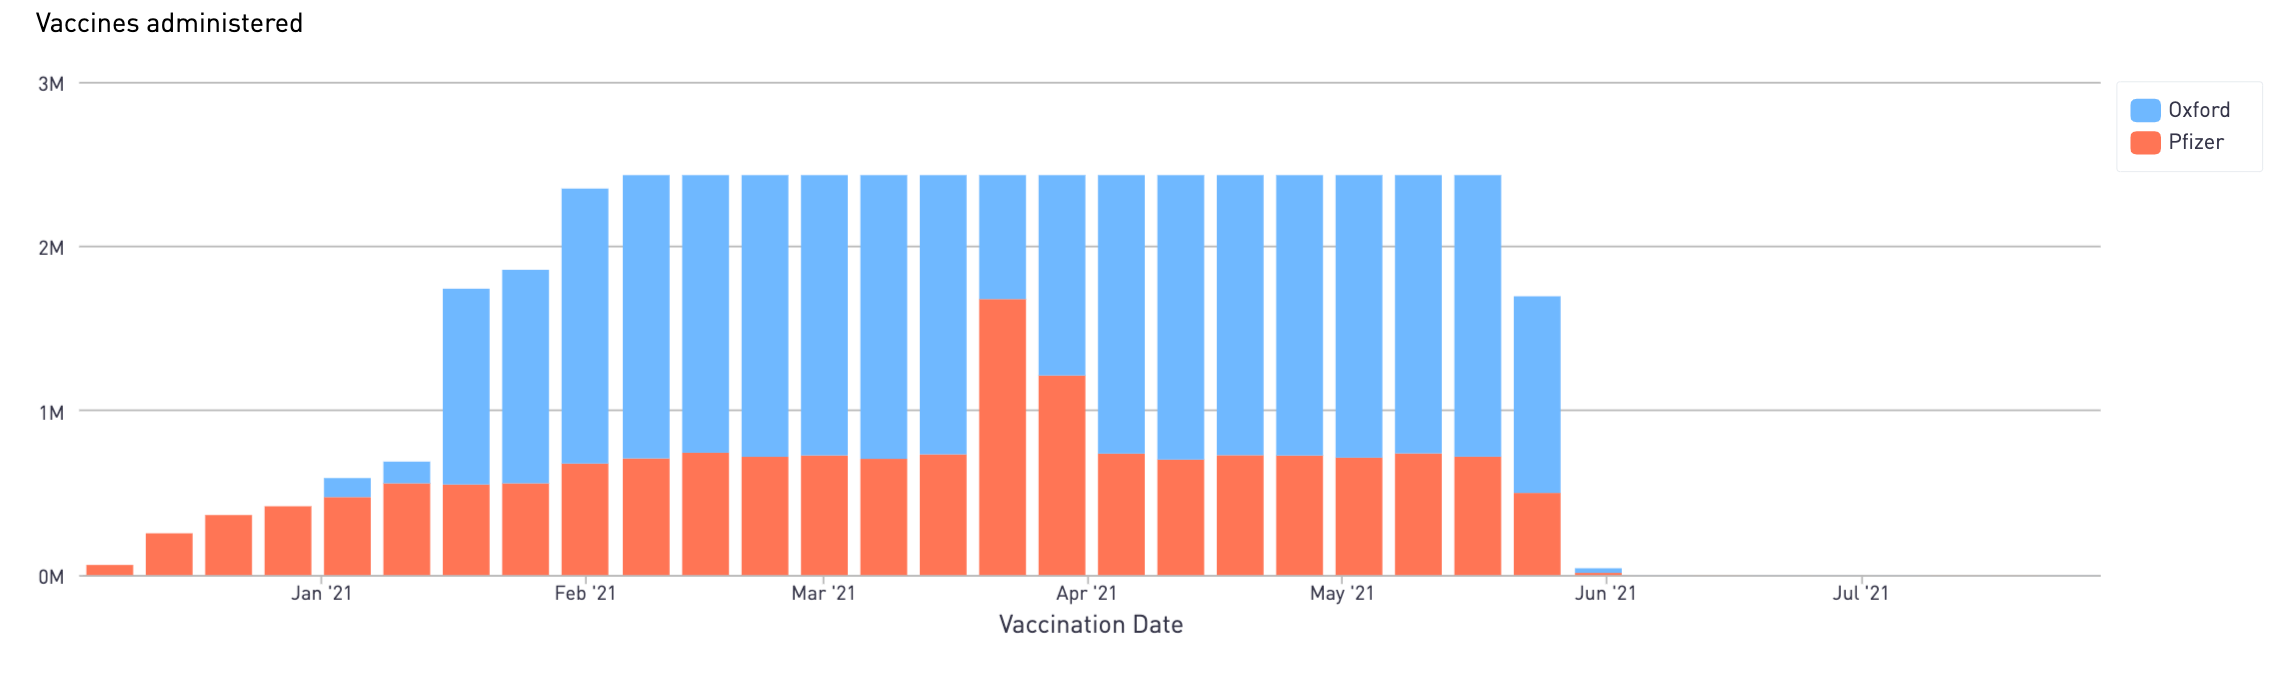
Based on the reported procurement of the Pfizer and Oxford vaccines, and the capacity of each vaccination site to administer them, we can simulate the projected use of each drug in the first half of the year.
The Pfizer spike in March, is when the second dose is now expected to be administered to the first wave recipients, based on the 2021 vaccination strategy.
Immunisation simulation - Phase 1 drug administation, 2021 strategy
Which locations are likely to be vaccinated first?
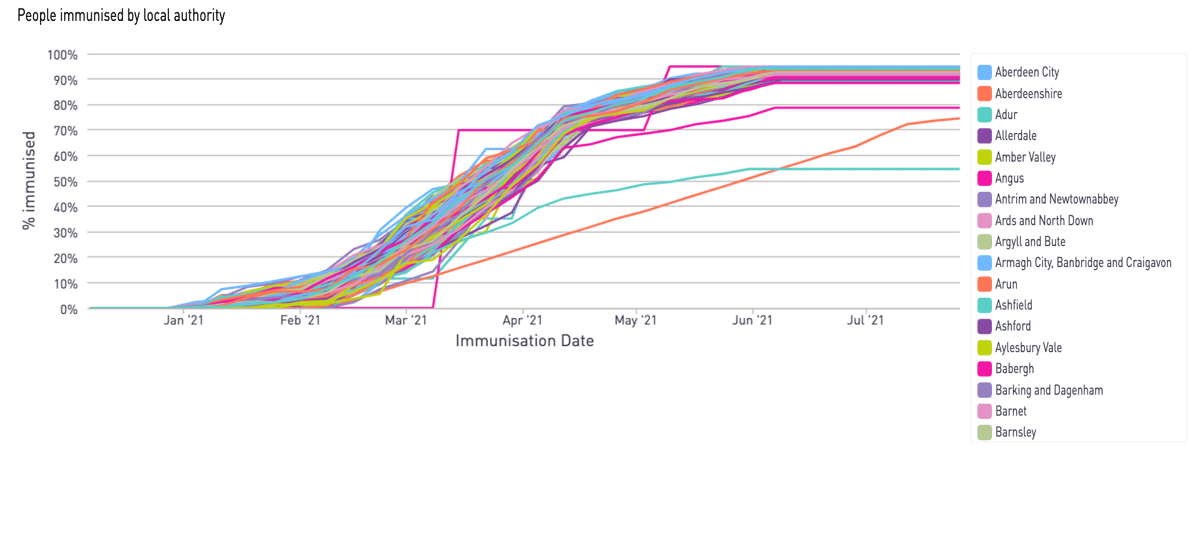
Using population data from the ONS, the 7bridges artificial intelligence simulates that the Isles of Scilly will be the first local authority to reach a 70% herd immunity milestone, the week commencing March 15th 2021.
This is significantly earlier than other areas with a greater number of people to vaccinate, such as South Staffordshire which the simulation predicts could reach a 70% immunisation rate the week of May 10th 2021.
Immunisation simulation - Local Authority immunisation timeline, 2021 strategy
 Even within regions, such as Greater London, there is a significant difference in the immunisation timelines for people living in certain Local Authorities.
Immunisation simulation - sample of Greater London Local Authorities immunisation timeline, 2021 strategy
.png?width=2778&height=918&name=Peopleimmunisedbylocalauthority%20(12).png)
Immunisation simulation - Greater Manchester Local Authorities immunisation timeline, 2021 strategy
.png?width=2778&height=918&name=Peopleimmunisedbylocalauthority%20(11).png)
If you're interested in how the 7bridges technology can simulate complex scenarios, such as the COVID-19 vaccination, drop us a line.
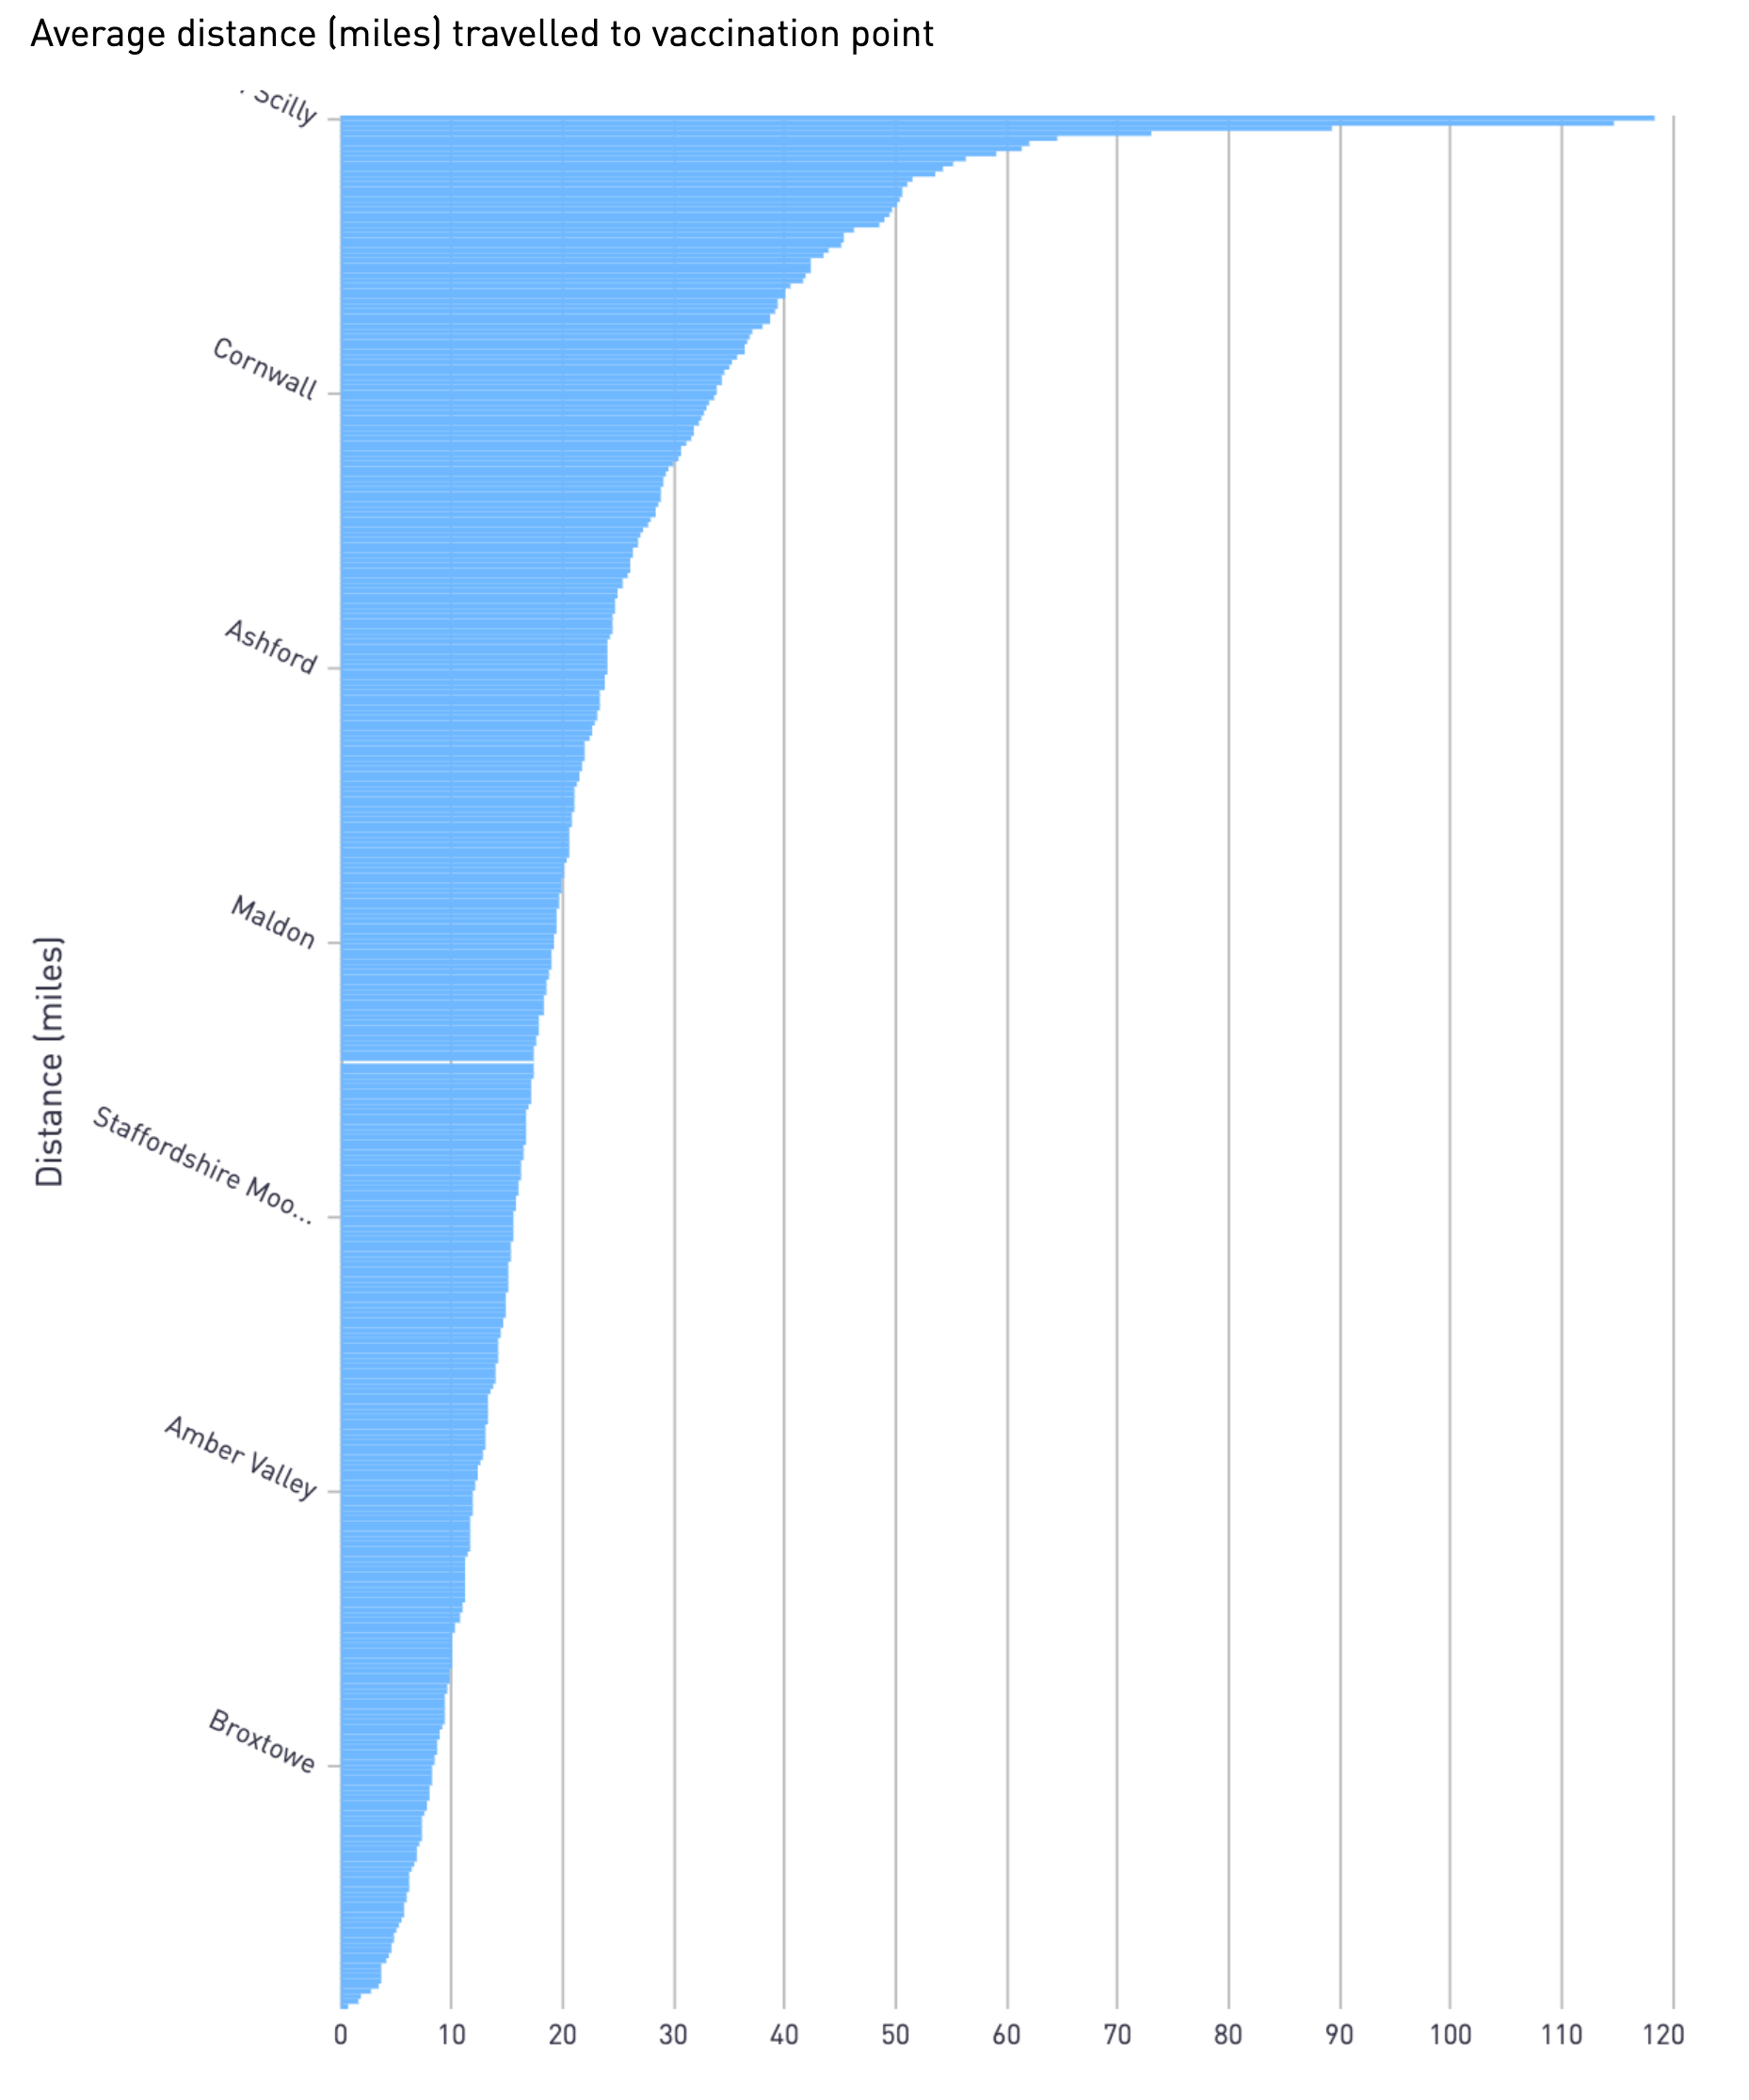
In a best-case scenario, how far will the over-fifties need to travel to receive their vaccination?
The average distance that most recipients in the first phase will need to travel 20.4 miles to their nearest vaccination point.
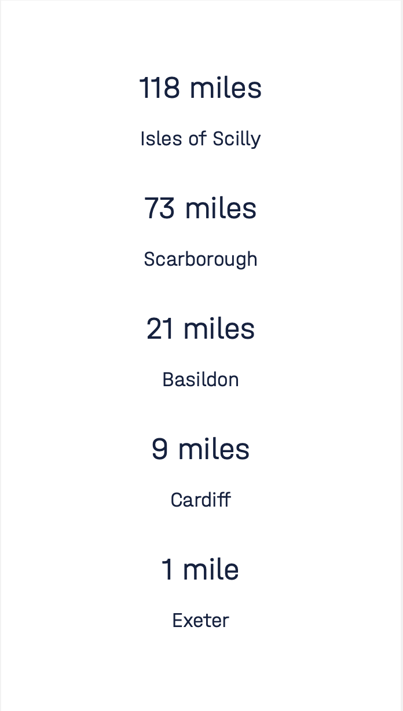
However, there is significant variation between Local Authorities. People in the isles of Scilly will need to travel 118 miles on average to receive their vaccinations.
Even in a less remote location, such as Scarborough, people will need to travel 73 miles, whereas people in Manchester will need to travel just under 2 miles on average and in Exeter, less than 1 mile.
|
|
Accessibility challenges
The simulation raises questions about the accessibility challenges faced by phase 1 recipients of the vaccine, Many people in th earlier waves of the programme are less mobile and may not have access to transport.
How will the Phase 1 recipients in more remote locations be supported in travelling to the nearest GP or hospital site?
When people are unable to get to their vaccination appointment, it will cause drug wastage and, of course, delay the time for that wave to reach herd immunity.
2021 Strategy - Time to immunity
In a best-case scenario, what is the timescale to reach herd immunity abasing Phase 1 vaccine recipients? Or, in other words, when might some parts of life 'return to normal'?
|
The truth is, this timescale depends in numerous factors and disruptors; some of which are outside the control of the UK government. When we first simulated the rollout, in late December 2020, Pfizer was the only vaccine being administered, and the Oxford vaccine wasn't expected to be rolled out until mid-February the following year. The UK Government was following the manufacturer's advice about a two dose strategy with 21 days between 1 and 2. In a best-case scenario, the 7bridges artificial intelligence predicted that 'herd immunity' - 70% of the 46 million people in Phase 1 - would be reached in the wee commencing 26th April 2021. |
|
Herd Immunity |
|
2020 Strategy w/c 26th April |
||
|
2021 Strategy w/c 5th April |
The new strategy in 2021, delays the second dose by 12 weeks. The Oxford vaccine has also been introduced to the UK's inoculation programme earlier than expected, with the first jab being administered on 4th January to Brian Pinker.
Our simulation shows that the new strategy could bring forward the 70% 'herd immunity' threshold by 3 weeks, to the week commencing 5th April 2021, if 'ideal conditions' are met.
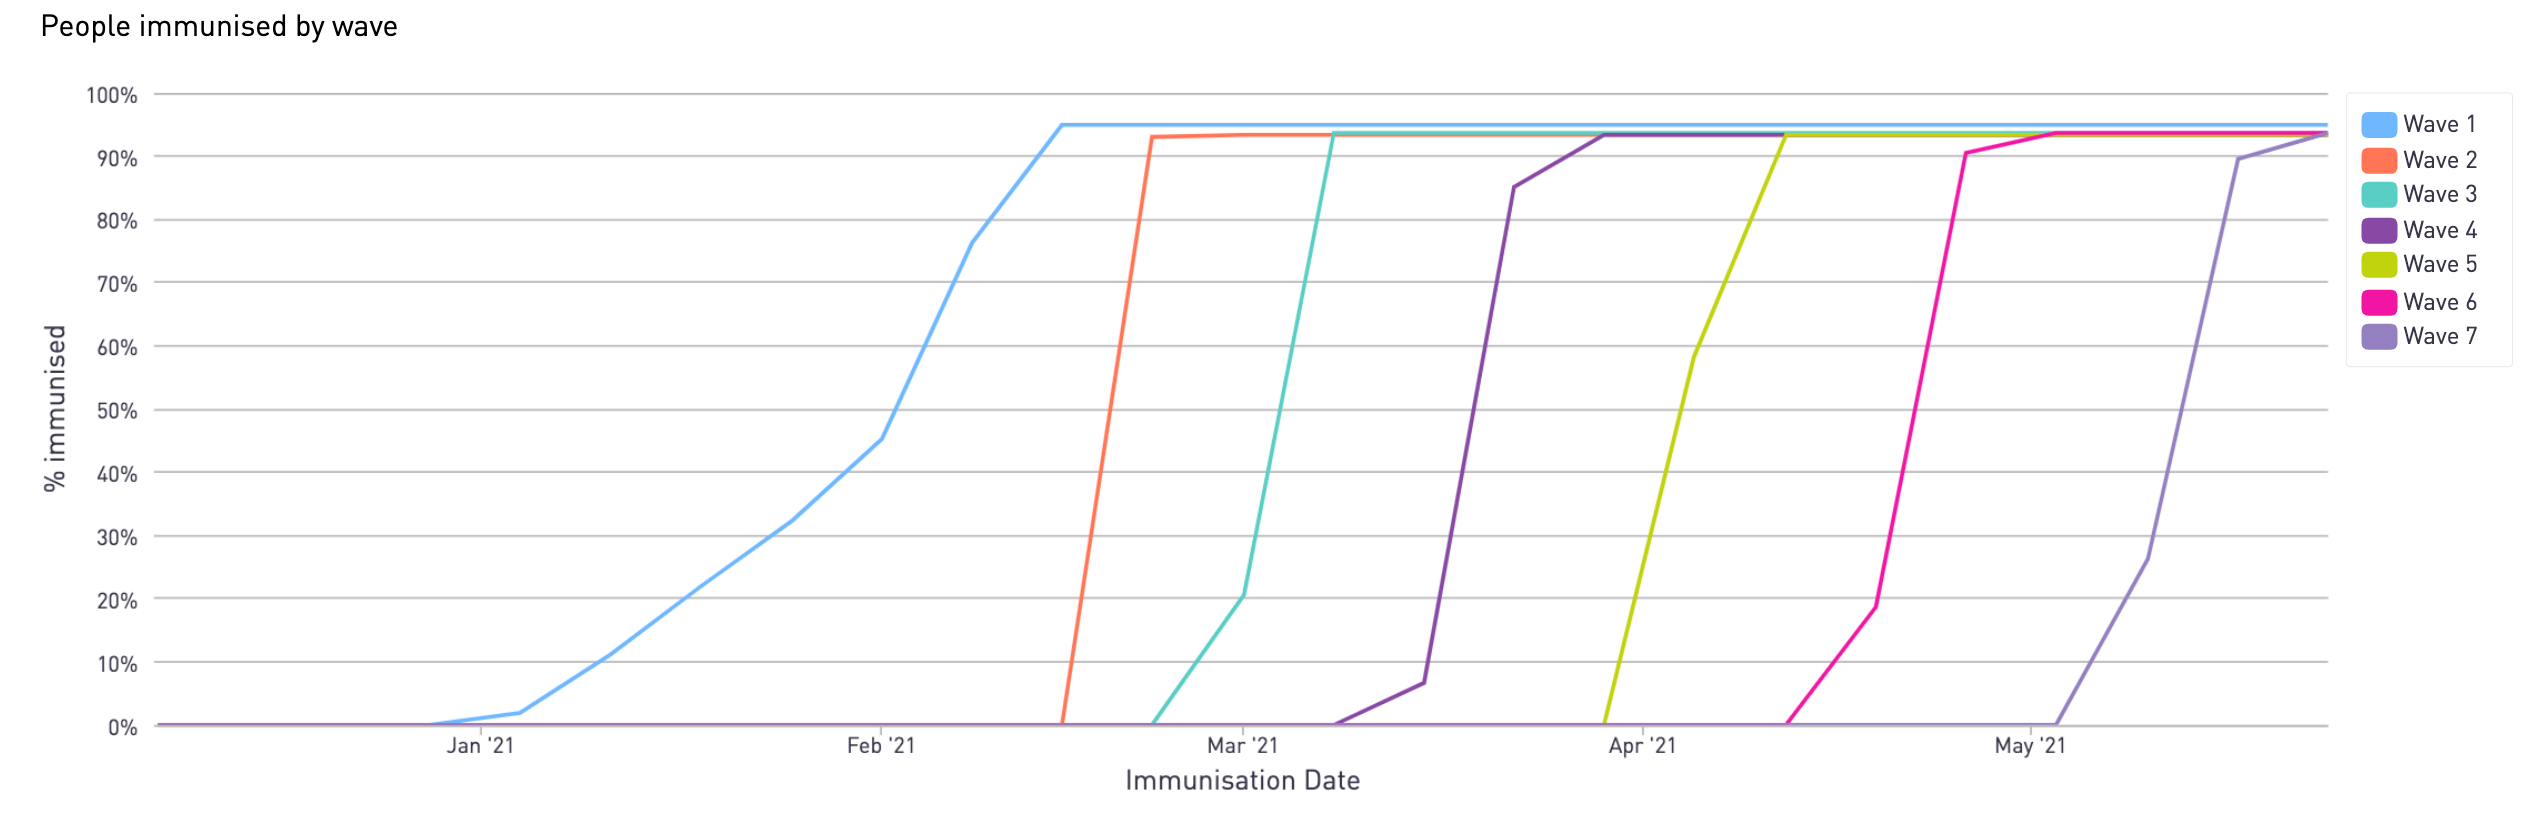
Vaccination simulation - Wave 1 to 7 vaccination timeline, 2020 strategy
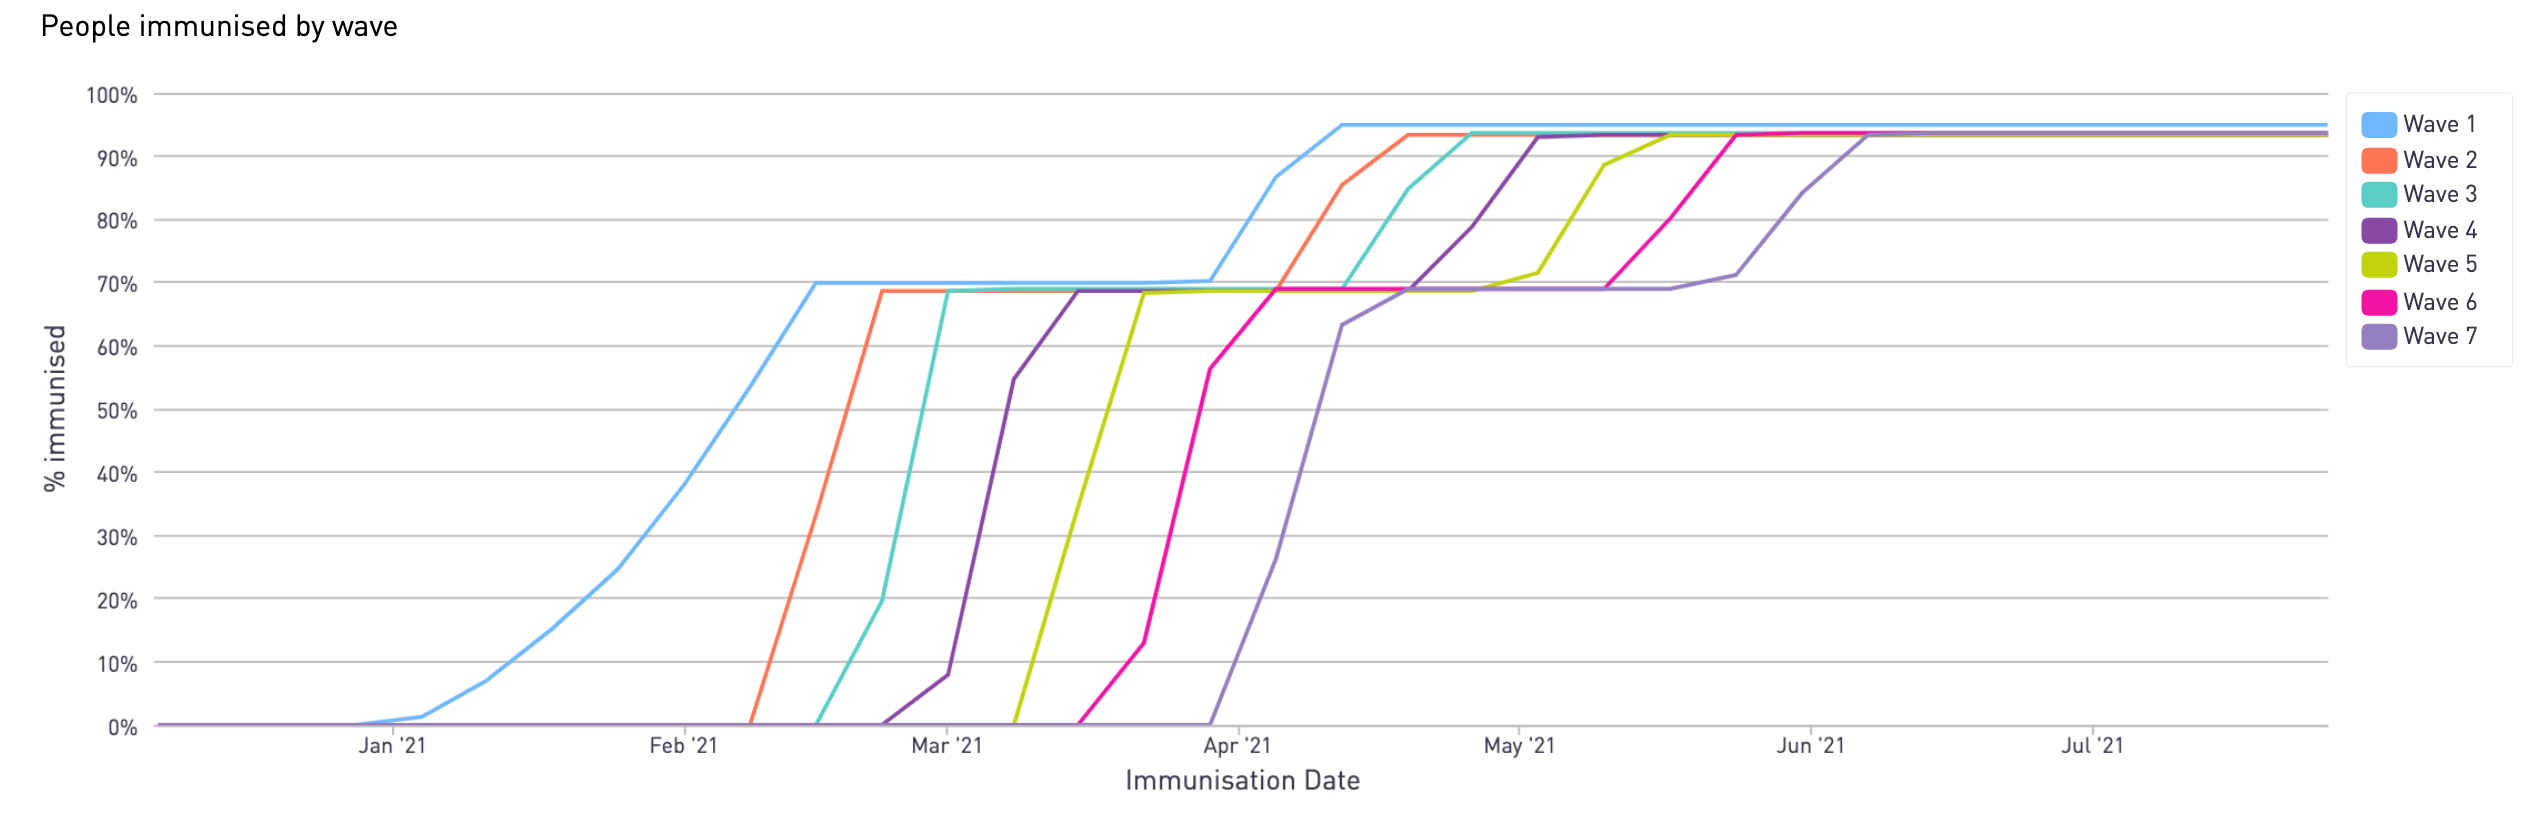
Vaccination simulation - Wave 1 to 7 vaccination timeline, 2021 strategy
 However, it is highly unlikely that we will enjoy 'ideal conditions' for the vaccine rollout, so in reality these milestones may be delayed. There are many potential disruptors to the programme, from the procurement issues, to Brexit-related delays and even simple things like forgotten appointments.
|
|
What is 'herd immunity'? |
|
|
|
|
Herd immunity refers to a proportion of a population, that once immunised, protects the wider population from illness (as there are fewer human hosts to spread the disease). Different diseases have varied thresholds for herd immunity:
A specific herd immunity threshold for COVID-19 is as yet unknown, but according to JAMA - American Medical Network, it is likely to be between 70 - 90%. It's also worth remembering that immunity takes a couple of weeks to develop after the first jab its administered, meaning people could still be infected if exposed to the virus shortly before or after their vaccination. |
What can limit our ability to reach herd immunity?
The speed at which UK's first cohort of vaccine recipients might reach herd immunity can be limited by many things, including:
Limited vaccine availability
|
The UK Government has ordered 100 million doses of the Oxford vaccine but just 4 million doses are expected to be available in the first quarter of 2021. The BBC reported that Pfizer has struggled to secure the raw ingredients needed to produce enough of the drug. |
Missed appointments and vaccine non-completion
|
Before the pandemic, 1 in 20 NHS appointments were missed in the UK. In the time of extreme disruption to travel, jobs and childcare, this figure could conceivably be higher. And, even if a recipient arrives for their first jab, they may not return for the second that is required for the Pfizer and Oxford. In other two-step vaccination programmes, such as HPV, a significant proportion of recipients fail to complete immunisation as they don't take their second dose. |
Vaccine efficacy rates
|
There have been questions over the efficacy rates of the vaccines, especially in relation to the 2021 strategy. The manufacturers of both the Pfizer and Oxford vaccines have said there is no evidence that demonstrates the recipient will still be protected if the booster jab is delayed. |
Post-Brexit delays

|
The Pfizer vaccine is manufactured in Belgium, and as if January first, will be crossing iut of Europe and into the UK. It is possible that there will be significant delays in transporting and releasing goods across borders. A contingency plan to airlift the vaccine into the UK may be a necessity. |
Storage and administration challenges
|
If the UK government does adopt an intelligent distribution plan - such as the one simulated by 7bridges - that delivers the correct volume of doses required to each administering site, there is still no guarantee that each site will be able to store the vaccines at the right temperature, or have the capacity to administer them. There is likely to be significant vaccine wastage as a result, which may lead to delays in the rollout. |
These are just some of the possible disruptors to the success of the vaccination programme. Unforeseen circumstances, a mutation of the virus which is unaffected by the current vaccination drugs, or so called 'Black Swan' events can of course play a part in our ability to reach herd immunity.
|
|
The rise of the anti-vaxxers |
|
|
|
In December 2020, ITV News reported that there are 5.35 million UK followers of anti-vaccine accounts on social media. These accounts that share false and misleading information about the vaccine, may encourage some people to refuse the jab.
|
|
Anti-vaxx simulation insights
Surveys show that between 5-30% of the UK population might not take the vaccine - and that there is a particularly distinct variation in anti-vixx sentiment among local authorities. 7bridges used the results of a nationally representative survey to model the potential impact of anti-vaxxers on the 2021 vaccination strategy.
If people fail to attend their vaccination appointment, there will be significant wastage of stock - which will in turn, increase the volume of required vaccinations.
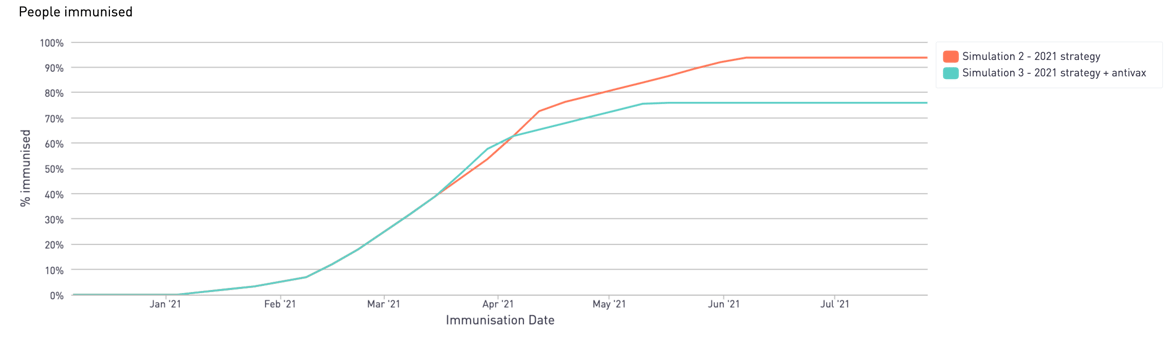
Simulation of anti-vaxxers impact on the UK's immunisation programme:
- 70% 'herd immunity' w/c 19th April 2021
- 76% max inoculation reached w/c May 10th 2021
Impact of anti-vaxxers sentiment
It's not just the availability of a vaccine in different local authorities, the population density of different age groups, or the accessibility of the vaccination sites themselves - but the level of anti-vccxx sentiment inherent in the community.
A nationally-representative COVID-19 vaccination acceptability study ('CoVAccS'), shows that the region in which recipient lives is almost twice as important as their age when determining a person's anti-vaxxers sentiment.
7bridges has taken this into account in the simulation of the first phase of the vaccination programme, and the results are stark.
2021 strategy - people immunised by local authority (sample)
.png?width=1173&height=386&name=7bridges%20-%202021%20strategy%20-%20People%20immunised%20by%20local%20authority%20(sample).png) 2021 strategy - people immunised by local authority accounting for local anti-vaxxers sentiment (sample)
2021 strategy - people immunised by local authority accounting for local anti-vaxxers sentiment (sample)
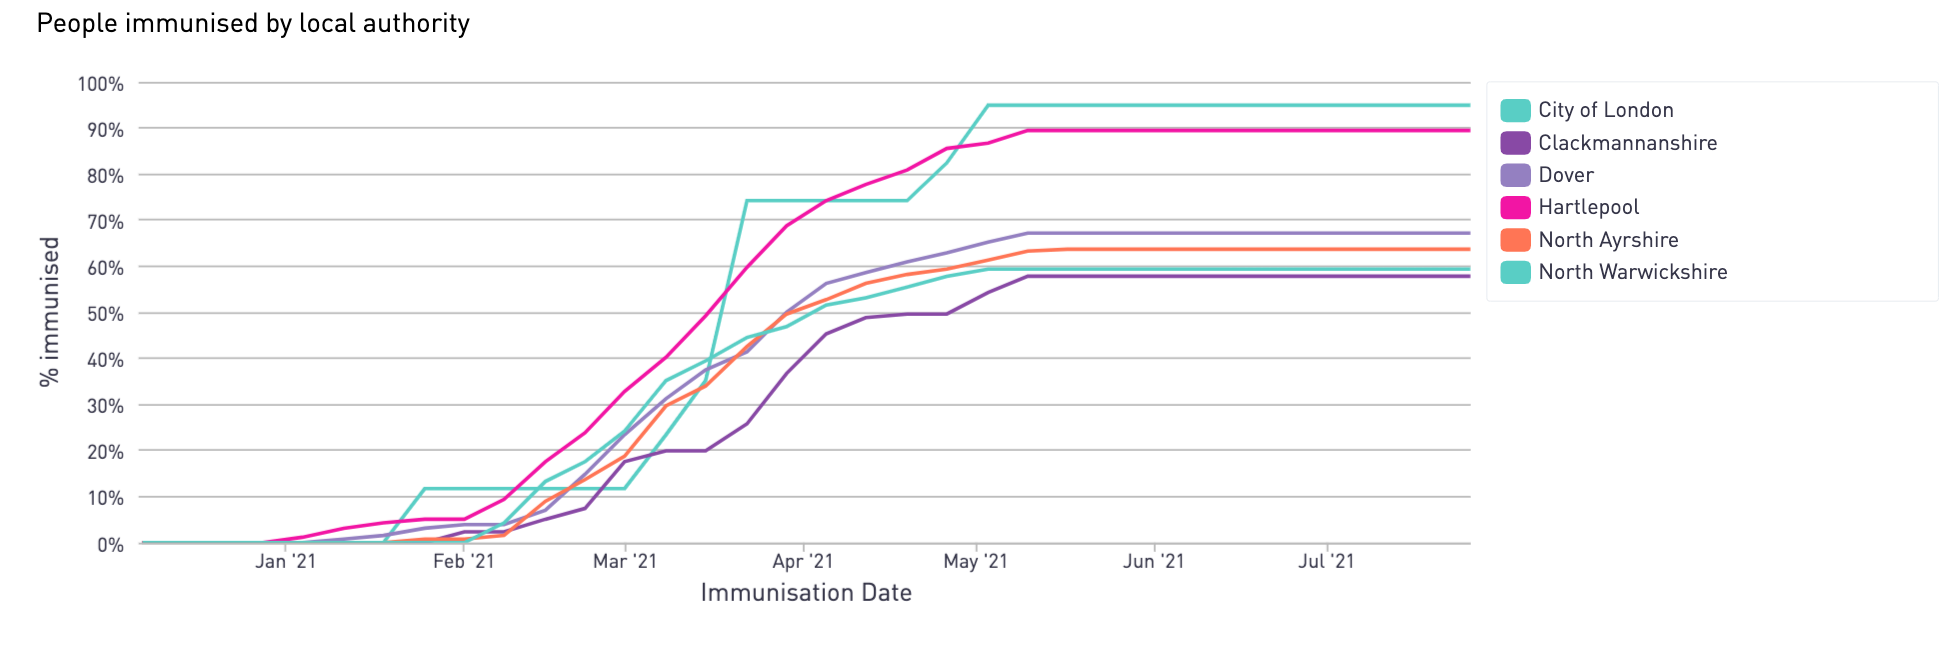
Some local authorities could still reach a max immunisation rate of 89% of the Phase 1 population (e.g. Hartlepool) whilst others only have 58% (e.g. Clackmannanshire) when anti-vaxxers sentiment is accounted for.
2021 UK Vaccination SimulationImpact of anti-vaxxers on immunisation in Local Authorities |
||
|
Location |
Max projected immunisation rate |
Projected immunisation ate - accounting for anti-vaxx sentiment |
|
City of London |
95% w/c May 31st |
95% w/c May 3rd |
|
Hartlepool |
95% w/c June 7th |
89% w/c May 10th |
|
Dover |
93% w/c June 7th |
67% w/c May 10th |
|
North Ayrshire |
93% w/c June 7th |
63% w/c May 10th |
|
North Warwickshire |
94% w/c May 31st |
59% w/c May 3rd |
|
Clackmannanshire |
92% w/c June 7th |
58% w/c May 10th |
Read more about the story in:
Wired UK:
https://www.wired.co.uk/article/coronavirus-vaccine-uk-distribution
Guardian:
Data sources
- ONS: Estimates of the population for the UK, England and Wales, Scotland and Northern Ireland
- COVID-19 vaccination acceptability study ('CoVAccS')
- The full list of every single hospital offering the Covid-19 vaccine in the UK
Logistics assumptions
- When considering which hospital will service a vaccination demand we look for the closest hospital that contains stock for a vaccine, and that has capacity to perform the vaccination.
- If that hospital doesn't have stock, the individual is assumed to get vaccinated at the next closest hospital that is less than 200km away. If none exist the individual waits until stock is available at a hospital less than 200km away.
- We assume no wastage of vaccine at each hospital/vaccination centre i.e. in the case of the Pfizer vaccine, the hospital is able to administer each dose before it's exposed to warmer than -70 C temperatures for a period of time that renders it unusable.
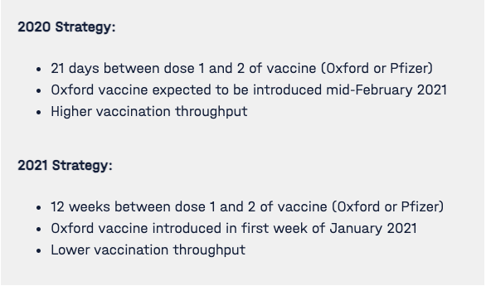
- 2020 Strategy:
- 2 doses, 21 days apart
- Oxford vaccine available mid-February
- Higher throughput at vaccination points
- 2021 Strategy:
- 2 doses, 12 weeks apart
- Oxford vaccine first week of January
- Lower throughput at vaccination points